

Source: ViewApart/iStock via Getty images.
It might come as no surprise that younger consumers are more likely to use streaming services, while older ones are more likely to engage with traditional TV. Regardless, all generations bundle them at fairly similar rates. Netflix and Amazon Prime Video remain the most used streaming services while Comcast and Charter are the largest traditional TV service providers. Churn rates for streaming services are relatively low overall, with most of the movement dictated by “service hoppers” who chase new content only to unsubscribe shortly thereafter and move onto the next new release.
This blog post presents findings from a recently conducted survey by 451 Research by S&P Global,which asked US consumers about their TV and streaming services as well as customer satisfaction.
Key takeaways from the survey
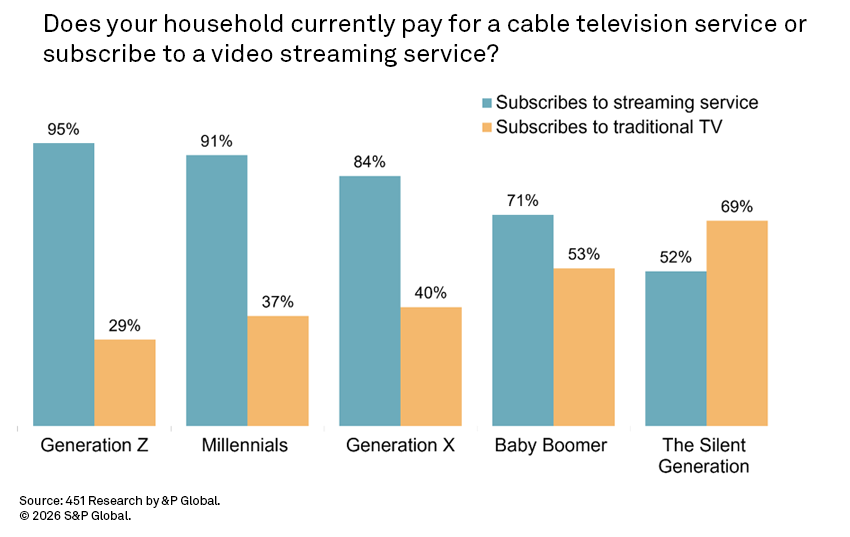
Traditional TV and streaming usage inverts based on age. Overall, 79% of respondents have at least one streaming subscription and 46% have a traditional TV service. Those numbers flip based on age. Generation Z (95%) is the most likely age group to have a streaming subscription and the least likely to have a traditional TV service (29%). Millennials and Generation X are more mixed, but still have streaming subscriptions (91% and 84%) at a higher rate than a traditional TV service (37% and 40%). Baby boomers and the Silent Generation, on the other hand, have the highest usage of traditional TV (53% and 69%) and the lowest streaming usage (70% and 52%) compared with the other cohorts.
The importance of bundling cuts across demographics. Overall, 45% of respondents indicated that one or more of their streaming subscriptions is part of a bundle or promotion. Interestingly, there is very little fluctuation across demographics. Looking again at generations as an example, all five adult age groups — Gen X (44%), baby boomers (45%), millennials (46%), Gen Z (47%), and the Silent Generation (47%) — are clustered together without much variation.
Netflix and Amazon hold commanding positions. Subscription rates remain stable across the paid streaming universe, with Netflix (55%) and Amazon Prime Video (54%) retaining the top spots. They are followed by Hulu (36%) and Paramount+ (30%). Rounding out the most deployed services are Disney+ (29%) and HBO Max (26%). There are bound to be some big shakeups later this year as Disney continues to integrate with Hulu, and Paramount+ and HBO Max move forward with their pending merger.
A handful of streamers stand above the rest in satisfaction. Subscriber satisfaction with their streaming services has been relatively uniform, as all of the top streaming platforms garner at least 90% overall satisfaction (very/somewhat satisfied). But breaking out just those subscribers who are very satisfied shows more differentiation. By this metric, Netflix (73% very satisfied) stands a bit above Discovery+ (71%). The next tier of providers includes Paramount+ (66%), Apple TV+ (64%), HBO Max (64%), Hulu (64%) and Peacock Premium (64%), which are all respectable ratings in their own right.
Limited overall churn in the streaming market. Nearly nine out of 10 current subscribers (88%) say they have no plans to cancel any of their streaming services in the next three months. On the other hand, three-quarters (76%) say they have no plans to start any new streaming subscriptions over the next 12 months. Most of the churn that does exist is likely driven by subscribers who jump in and out of services throughout the year. This typically coincides with the release of new content as some subscribers will join for a limited time to watch new content, and then unsubscribe rather than keep the subscription active year-round.
Comcast and Charter stand out in the traditional TV space. As subscription rates to traditional TV services continue to wane, two companies stand out with the biggest chunks of the market: Comcast (27%) and Charter (23%). They are followed distantly by Verizon (9%), Direct TV (8%) and AT&T (7%).Amazon (57%). As seen in other consumer tech segments, Apple’s high satisfaction ratings are a key factor in its dominant position.

The Smart Home Era is Here
Want insights on consumer technology trends delivered to your inbox? Join the 451 Alliance.
