

Source: Jonas Leupe via Unsplash.
The core conclusion is straightforward: While the overall payments market continues to expand, the industry’s most attractive growth opportunities are concentrating unevenly across regions, channels and payment methods.
The Take
The global payment processing market is entering its next phase of growth, but the opportunity for processors is becoming increasingly uneven. Volume growth is strongest in Asia-Pacific, digital commerce and wallet-centric experiences, forcing processors to rethink both geographic expansion and product strategy. At the same time, the industry’s revenue pool remains disproportionately concentrated in North America, highlighting a growing disconnect between where payment volume grows fastest and where processors monetize most effectively.
Pursuing payment volume growth remains as important as ever, but value creation and margins are shifting toward software-driven infrastructure layers such as optimization, orchestration, fraud management and embedded payment workflows. Scale still matters, but increasingly it is platform sophistication, value-added capabilities and adaptability — not size alone — that will determine long-term share gains.
Highlights
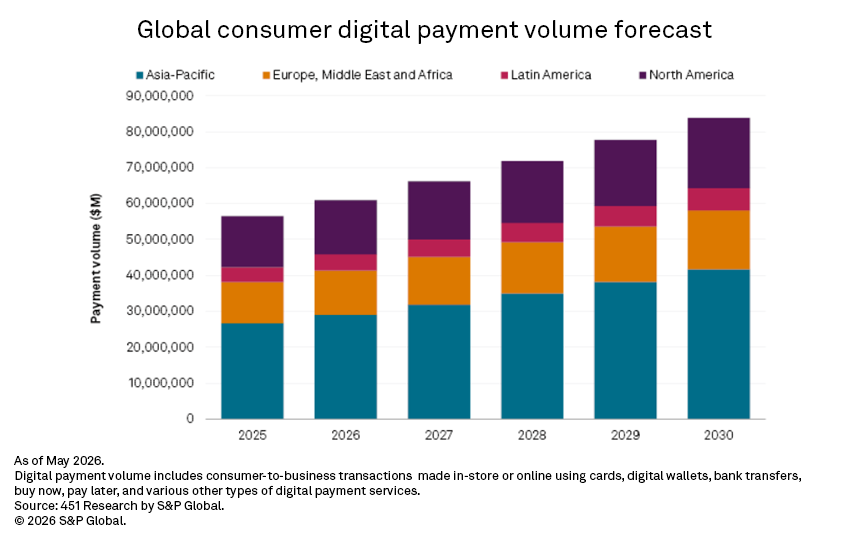
Global payments growth is increasingly Asia-Pacific-driven. Global payment volume is on track to reach nearly $83.9 trillion by 2030 at a compound annual growth rate of 8.2% over the forecast period. Asia-Pacific will drive the majority of incremental growth, adding roughly $15 trillion in volume to reach $41.7 trillion by 2030. North America remains a large and profitable market, growing at a 6.6% CAGR to $19.6 trillion, but its share of global volume declines from 25.1% in 2025 to 23.3% by 2030. Sustaining above-market volume growth increasingly requires either cross-border exposure or expansion beyond domestic acquiring.
E-commerce continues to take share from in-store payments through 2030. While in-store remains the majority of global volume, accounting for 60.6% in 2025 and 57.8% in 2030, e-commerce compounds at around an 9.7% CAGR versus a 7.2% for in-store, contributing approximately $13 trillion in incremental volume over the period. The widening growth gap continues to shift value creation toward the infrastructure layers that power digital commerce — including checkout optimization, fraud prevention and payment orchestration — and away from traditional card-present acquiring.
Wallets already own more than half of global volume, and they are still gaining. Digital wallets are the largest payment method globally at $31.1 trillion in 2025 (55.0% share), extending their lead to $48.2 trillion and 57.5% share by 2030. Cards appear to be on a relative decline — from 41.1% share in 2025 to 37.5% by 2030 — but this overstates displacement. Significant card volume flows through card-centric wallets like Apple Inc.’s Apple Pay and Shopify Inc.’s Shop Pay, making the shift more of a behavioral change in how consumers access card credentials than a structural departure from card rails. Buy now, pay later (BNPL) represents a different dynamic. At an 18.3% CAGR, it is the fastest among established payment methods and growing at nearly three times the rate of cards. At $1.28 trillion by 2030, it remains a fraction of card volume, but the trajectory demands product support. Merchants increasingly expect processing partners to offer BNPL at checkout as a native option, not an integration afterthought.
Fast-growing payment markets are not always the most profitable ones. Global payment processing revenue is forecast to reach $167.2 billion by 2030 at a 6.9% CAGR. The opportunity is real, but volume growth and revenue growth are not the same thing — and processors that conflate the two when sizing international expansion will overestimate returns in the markets growing fastest. North America generated 42.9% of global processor revenue in 2025 on just 25.1% of global payment volume. Asia-Pacific is the inverse at 47.2% of volume and only 19.9% of revenue, a gap driven by structurally lower take rates rooted in the dominance of domestic wallets, account-to-account payment methods and local competition that limits processor pricing power. Processors entering or expanding in Asia-Pacific for volume growth need financial models that reflect the revenue-per-dollar reality of the region, not blended global assumptions.
Fewer than two dozen processors control 79% of global revenue, but scale alone does not close every deal. Of 563 payment processors and gateways tracked, 25 generate $1 billion or more in annual processing revenue, collectively accounting for 81 of total market revenue, 76% of volume and 68% of transactions. At the other end, 450 processors — 80% of all vendors — fall below $50 million in revenue, collectively generating $3.3 billion, roughly equivalent to a single mid-tier processor. Scale continues to create structural advantages in economics, distribution and platform investment capacity. However, smaller processors remain competitively resilient in verticals, geographies and merchant segments where localized relationships, vertical specialization and/or tailored workflows outweigh pricing advantages. As consolidation accelerates, the strategic challenge for scaled processors is not simply acquiring share, but systematically penetrating the merchant segments where specialized and regional providers continue to outperform.
Together, Stripe LLC and Adyen NV already process nearly one out of every $12 spent globally. Their rise represents one of the defining competitive shifts in modern payments. Both companies have achieved remarkable scale in less than two decades while continuing to grow payment volumes at roughly three to four times the broader industry average. Their rapid ascent underscores the shift toward modern, software-centric payment infrastructure and suggests a significant share opportunity still lies ahead.

The Smart Home Era is Here
Want insights on fintech trends delivered to your inbox? Join the 451 Alliance.
