

Source: ridvan_celik/iStock/Getty images.
Both Tablets and PCs are showing a rebound in demand after bottoming out in last year’s Q3 survey. Apple, Dell, HP and Samsung continue to be the most consistent manufacturers across these device categories, each having areas where they perform the best. Higher-income households are fueling much of this rebound as they are generally in a better financial situation compared with lower-income ones.
This blog posts presents the findings of a study conducted by S&P Global Market Intelligence 451 Research, which asked US consumers about their current tablet, desktop and laptop ownership, as well as customer satisfaction and future purchasing plans.
Key takeaways from the survey
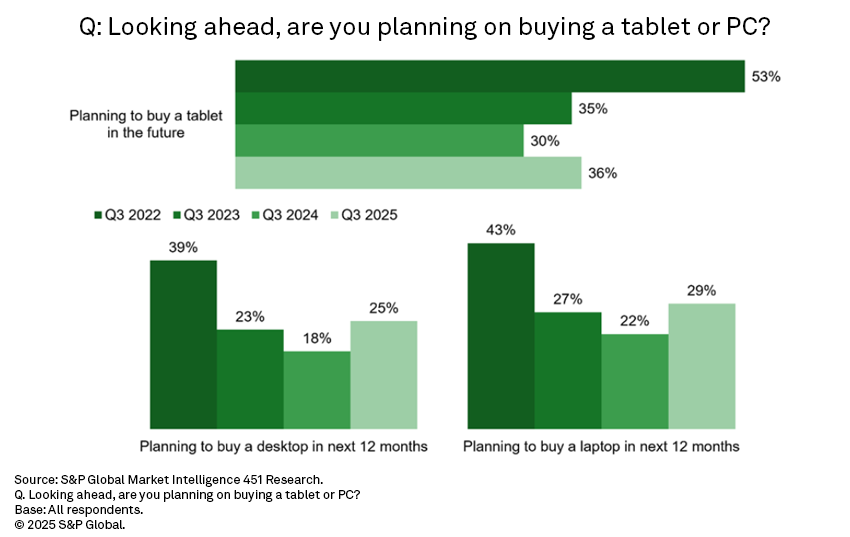
Rebound in planned tablet and PC buying. After bottoming out in last year’s Q3 survey, planned tablet buying is showing a 6-point bounce back, with 36% of respondents saying they plan to buy a tablet in the future. While this is up compared with last year, it’s still well behind the 53% seen in Q3 2022. The survey shows a similar pattern with planned purchases of PCs. Desktops (25%) are showing a 7-point rebound in planned buying since last year’s 18% but are similarly well behind the 39% seen in Q3 2022. At the same time, laptops (29%) are experiencing a 7-point increase compared with last year (22%), but also remain well below Q3 2022 (43%).
Higher-income households are driving the increase in tablet and PC buying. These year-over-year increases in overall tablet and PC demand seem to be obscuring an underlying trend. The vast majority of the rebounds in our Q3 survey are being driven by higher-income households (more than $100,000 per year). Looking first at tablets, higher-income households are showing a 12-point year-over-year increase in purchasing intent (from 35% to 47%), while lower-income households (less than $50,000 per year) are showing a much more modest 3-point increase (from 29% to 32%). Switching to PCs, the same pattern emerges as higher-income households show bigger increases in planned purchasing than lower-income ones, both in desktops (up 17 points versus a 4 point rise) and laptops (up 14 points versus a 4 point increase).
A closer look at tablet buying
Apple is king of the hill. The top tablet manufacturers are holding their ground when it comes to their share of planned buyers. Apple (47%; up 5 points) remains the undisputed leader of this device category, with Samsung (20%; unchanged) in a distant but stable second place. Every other manufacturer after that is in single digits. The jump in interest around Apple is likely a tandem move with the increase in planned buying among more affluent households.
A look at retention and churn. Customer retention refers to the percentage of current owners who plan to buy their next tablet from the same manufacturer. Apple’s customer retention (82%) remains far superior to that of every other manufacturer, including Samsung’s (51%). In other words, the vast majority of Apple iPad owners who plan on buying another tablet in the future say they’ll buy another iPad, whereas far fewer will do the same when it comes to other manufacturers. These market dynamics suggest there will be no real challengers to Apple’s leading position.
Satisfaction is key. Apple remains the leader in tablet satisfaction, with 72% of current owners saying they are very satisfied with their iPads. It is followed by Samsung (65%), Microsoft (62%) and Amazon (61%). Microsoft is the outlier, with well-reviewed devices yet an inability to consistently acquire and retain customers. Google sometimes finds itself in this position as well, but not in the current survey. This continues to be likely due, at least in part, to product ecosystems of interoperable devices that seem to favor Apple and Samsung.
A closer look at PC buying
HP and Dell stand tall in desktops. HP and Dell have been the longtime leaders in the desktop market, while Apple remains solidly in third place. These three remain the only manufacturers with double-digit ownership. In fact, when it comes to planned buying over the next 12 months, Apple (38%) has consistently been the brand that draws the most interest among buyers, followed by HP (24%) and Dell (23%). Yet, even with Apple consistently outdrawing the competition in terms of purchasing intent, it has not been able to overtake HP or Dell in overall ownership.
Apple reclaims top spot in desktop satisfaction. After last year’s surprising pop in satisfaction for HP, Apple (73%) has once again reclaimed the mantle, with the most owners saying they are very satisfied with their desktop computer. For their part, HP (64%) and Dell (63%) are on comparable footing with each other. This remains a market where multiple manufacturers continue to put out quality products, which can lead to swings in relative satisfaction levels seen in our surveys.
HP leads in laptop market. HP maintains a comfortable lead over Dell, Apple and Lenovo in current laptop ownership. Similar to desktops, Apple (35%) leads among planned laptop buyers over the next 12 months. Yet HP’s (23%) strong showing in second place allows it to maintain its status as the most owned brand. Overall, the laptop market is the most competitive, with Dell (17%), Samsung (13%), Lenovo (11%) and Microsoft (10%) all also capturing double-digit market share.
Laptop satisfaction mirrors competitiveness seen in market. Samsung (72%) and Apple (71%) have the most owners who say they are very satisfied with their devices. Additionally, HP (66%), Microsoft (65%), Lenovo (62%) and ASUS (62%) are clustered together not too far behind. Similar to desktops, the year-over-year changes in satisfaction ratings are likely the result of having multiple quality products on the market.
The Smart Home Era is Here
Want insights on consumer technology trends delivered to your inbox? Join the 451 Alliance.