In the 451 Alliance’s February IT Spending survey, we asked corporate respondents about the latest trends in smartphones. The results provide insight into their companies’ smartphone purchasing plans, current usage and customer satisfaction.
Planned Smartphone Purchasing
Our current findings show an increase in overall planned smartphone purchasing (21%; up 2-points) that exceeds the pre-COVID-19 levels we picked up in February 2020. This aligns with the category-specific spending we explored in the main IT spending report, where mobile devices showed a net-positive increase in spending plans over the next 12 months.
Unsurprisingly, the biggest swings in purchasing plans were among larger companies (more than 1,000 employees). This group went from 46% buying smartphones in February 2020 to 41% currently. On the other hand, smaller companies (fewer than 1,000 employees) were steadier, but are also buying smartphones at a much lower rate compared to larger organizations – going from 14% in 2020 to 15% currently.
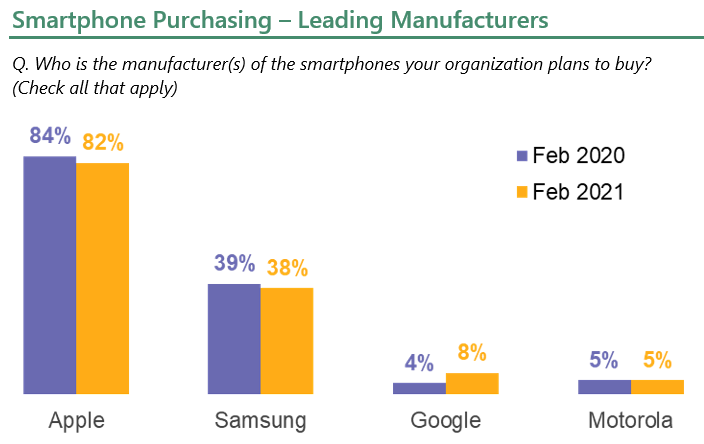
Apple (82%) continues to enjoy tremendous corporate demand, regardless of the fluctuations in overall purchasing plans – and even the fluctuations in manufacturer-specific planned purchases – further solidifying its position as the top smartphone manufacturer for businesses.

Samsung (38%) remains a distant second, although the company is well ahead of Google (8%) and Motorola (5%). Even with the increase in demand for Google smartphones, there continues to be little overall movement within the corporate smartphone market. Businesses’ intent to purchase is controlled by the top two companies, which are well entrenched with huge leads over their nearest rivals.
Among specific models, the iPhone 12 (25%) is the top Apple smartphone that companies plan to buy. Demand for the iPhone 11 (18%) remains solid, followed by the iPhone 8 (15%) and iPhone 12 Pro Max (13%). Importantly, 30% of respondents don’t know which models their company will purchase. The phones ultimately purchased by this group will have a material impact on the final tallies for iPhone model demand.
For Samsung, the Galaxy S21 5G (20%) and the Galaxy S10 (20%) are the most in-demand models. Just as with Apple, a large number of planned buyers are undecided at this time. In fact, likely due to the timing of new releases relative to the fielding of the survey, more respondents are unsure of which model to buy compared with this time in 2020.
Current Smartphone Usage
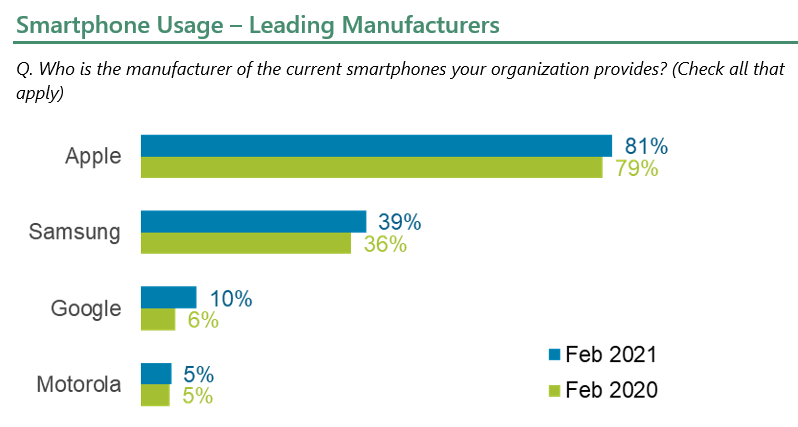
The number of companies providing smartphones to their employees (45%) is a few points higher that we saw in February 2020 (42%), likely a result of almost a year of work-from-home policies and adapting to remote-work business practices. In terms of manufacturers, Apple (81%; up 2-points) remains the most popular brand, followed distantly by Samsung (39%; up 3-points). Google (10%; up 4-points) has created a little bit of a cushion ahead of Motorola (5%; unchanged). Notably, all three of the top manufacturers have increased their share of the business market compared with 2020.

A primary reason for Apple’s strong performance is its outstanding customer satisfaction ratings – and this quarter is no different. Current iOS users are more satisfied with their phones (93% very or somewhat satisfied) than their biggest rival platform, Android-powered phones (91%). The satisfaction ratings for both companies are holding steady regardless of some quarter-to-quarter fluctuations.
